How to Analyse Your Spending From Bank Statements Without Linking Your Bank
Every budgeting app wants the same thing first: your online banking credentials, or an open banking connection to your accounts. That is a large permission to grant to see something your statements already contain.
Bank feeds are convenient and, through regulated open banking, reasonably safe. But they carry conditions worth weighing: a third party gains ongoing read access to your accounts rather than a one-off look, the connection is usually tied to a subscription that ends when you stop paying, feeds break and silently miss transactions, and history is typically limited to what the connection can reach — often twelve or twenty-four months, which is too short for exactly the questions worth asking.
Statements have none of those properties. They are complete, they are the bank’s own record, they go back as far as you have kept them, and they are already sitting on your computer.
The questions worth answering
Vague spending analysis produces vague results. These are the questions that reliably change a decision:
- What does a normal month actually cost? Not the budget — the median of twelve real months, which is the figure that matters for an emergency fund or a mortgage affordability calculation.
- What is committed versus discretionary? Rent, utilities and subscriptions leave before you decide anything. Knowing the committed floor tells you what is genuinely flexible.
- What is recurring and forgotten? Identical amounts repeating monthly are the highest-yield thing in the whole exercise. Most people find at least one.
- Which months break the pattern, and why? Annual insurance, tax payments, holidays. These are the months that cause overdrafts, and they are predictable a year ahead.
- Is the trend up or down? Year on year for the same month strips out seasonality, which month-to-month comparison cannot.
Building the analysis from statements
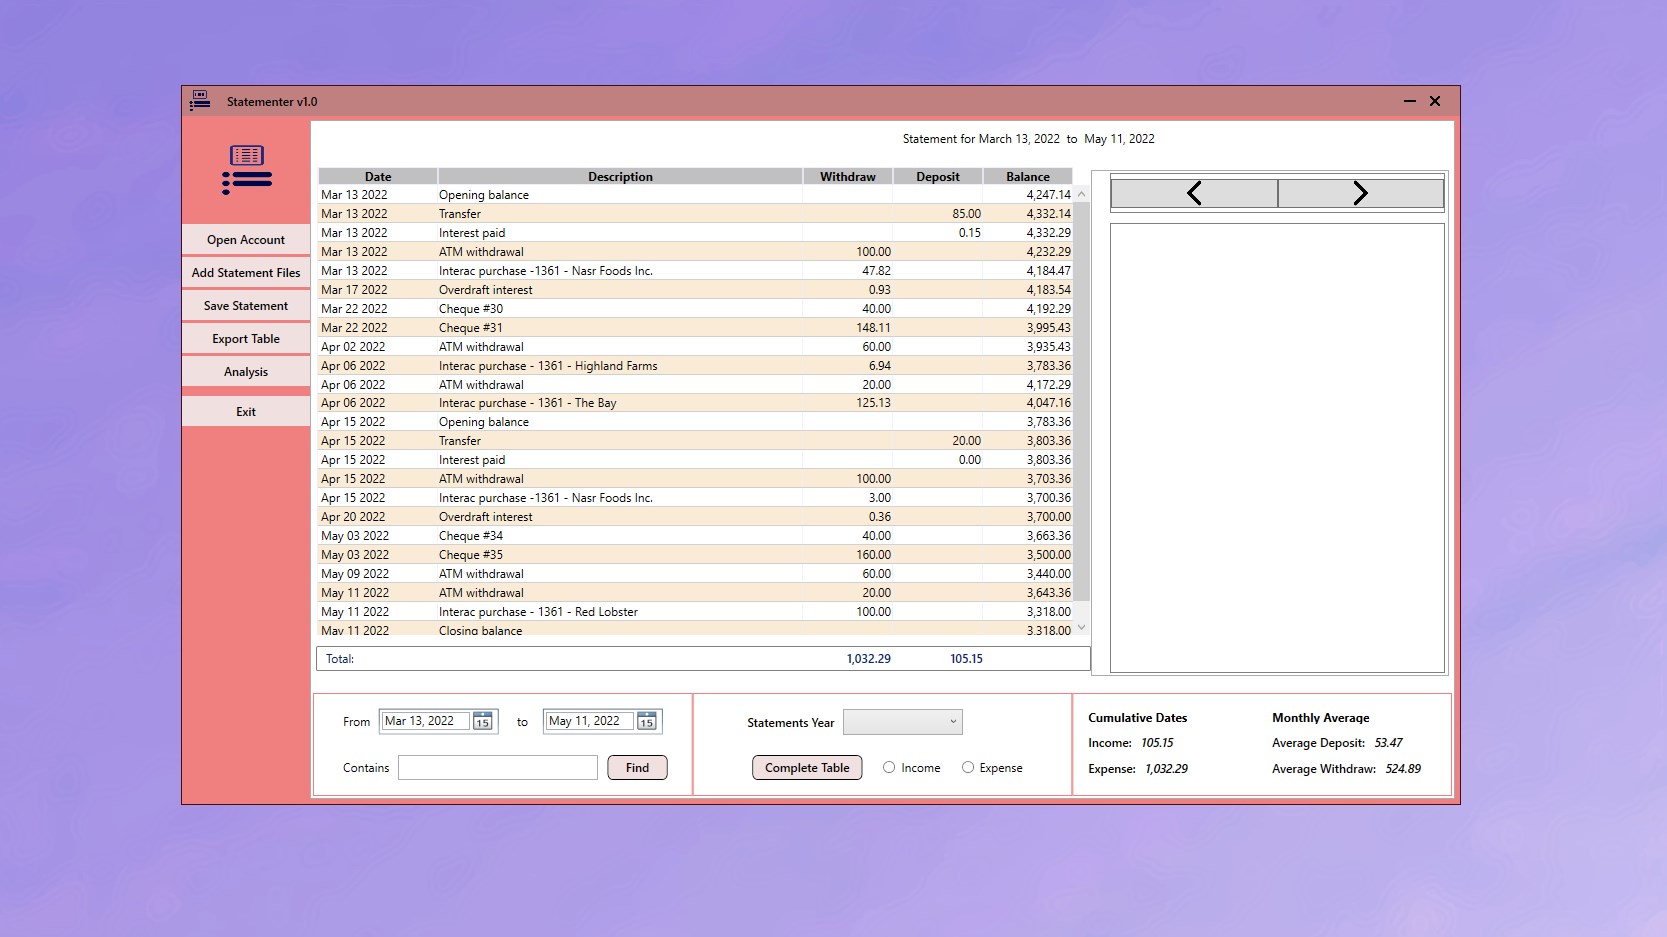
Statementer reads the statement PDFs, separates transactions by account, and provides monthly and yearly views of the transactions — with CSV export when you want to go further in a spreadsheet. It runs on your Windows PC with no bank connection and no account.
-
Download a full twelve months of statements
Anything less cannot show annual charges or seasonality, and those are what distort a budget. Download the complete period as PDFs from online banking, for every account you use.
-
Load them all into Statementer together
Add the statements as a batch. Transactions are separated by account automatically, which matters if spending is split across a current account and a card.
-
Establish the cost of a normal month
Use the monthly view and take the median rather than the average — one holiday or one annual insurance payment drags an average upward and gives you a figure no real month resembles.
-
Hunt the recurring charges first
Look for identical amounts repeating month after month. This is the highest-value ten minutes in the exercise: forgotten subscriptions, replaced services still billing, duplicates across accounts.
-
Identify the spike months and their cause
Find the months well above the median and search that period to see what caused them. Annual renewals and tax payments are predictable a year in advance once you have seen them once.
-
Export to CSV and pivot for the detail
Export the transactions and build two pivot tables in Excel or Google Sheets — month against total, and merchant against total sorted descending. The top twenty merchants are usually most of the spending.
Start with the recurring charges, not the categories. Categorising a year of spending is satisfying and slow. Sorting by amount and looking for the same figure repeating monthly takes ten minutes and is where the money actually is: the trial that converted, the service you replaced but never cancelled, the duplicate subscription across two accounts.
Going further in a spreadsheet
Once the transactions are in CSV, a pivot table answers most remaining questions in a few minutes. The two that repay the effort:
- Month against total, to see the shape of the year and identify the spike months.
- Merchant against total, sorted descending. The top twenty rows are almost always eighty per cent of the spending, and the list is usually surprising.
For sole traders and small businesses the same export feeds directly into year-end preparation — see preparing a year of statements for your accountant.
The honest limits
Statement analysis is retrospective, not live: you are working with completed periods, so it will not tell you what you have spent this week. It also has no automatic categorisation — the transactions are grouped and searchable, but assigning them to categories is a spreadsheet exercise you drive.
For monitoring day-to-day balances, a banking app already does that well and free. What statement analysis gives you is the longer view over as much history as you have kept, from the bank’s own record, without granting anyone standing access to your accounts.
Get Statementer
Monthly and yearly analysis from the statements you already have. No bank connection, no subscription.
View on the Microsoft Store$19.99 USD · one-time purchase · Windows 10 & 11
Frequently asked questions
How can I analyse my spending without linking my bank account?
Use the statements themselves. They are the bank’s complete record, they go back as far as you have kept them, and they are already on your computer. Statementer reads statement PDFs on your Windows PC and provides monthly and yearly analysis plus CSV export, with no bank connection, no credentials and no account.
Is it safe to connect a budgeting app to my bank?
Regulated open banking connections are reasonably safe and do not give the app your banking password. The considerations are different ones: the third party gets ongoing read access rather than a single look, access usually persists until you revoke it, and the history available is often limited to the last twelve or twenty-four months. Working from statements avoids granting standing access at all.
How far back should I analyse my spending?
Twelve months minimum. Anything shorter cannot reveal annual charges — insurance renewals, tax payments, yearly subscriptions — or seasonal patterns, and those are precisely the items that break budgets built on a three-month sample.
How do I find subscriptions I forgot I was paying for?
Sort the transactions by amount and look for the same figure repeating monthly or annually. This finds them faster than categorising, because subscriptions charge identical amounts on a regular cycle. Once you spot one, search its description to see when it started and what it has cost in total.
Should I use the average or the median monthly spend?
The median. A single holiday, annual premium or tax payment pulls the average up and produces a figure no actual month resembles. The median describes a typical month, which is what an emergency fund or an affordability calculation should be based on.
Does Statementer categorise transactions automatically?
No. It extracts transactions from statement PDFs, separates them by account, offers fuzzy search and monthly and yearly analysis, and exports structured CSV. Categorisation is something you do in a spreadsheet using that export, which also means the categories are yours rather than a vendor’s guess.